Multiple Choice
The diagram below shows a light curve from a supernova.How many days after maximum light did it take for the supernova to decrease in brightness by a factor of 100? 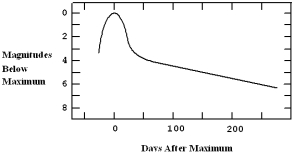
A) 25
B) 50
C) 100
D) 150
E) 250
Correct Answer:

Verified
Correct Answer:
Verified
Related Questions
Q4: The explosion of a supernova typically leaves
Q6: A type-II supernova<br>A) occurs when a white
Q7: A white dwarf whose red giant companion
Q8: The Algol paradox is explained by considering<br>A)
Q10: A planetary nebula<br>A) produces an absorption spectrum.<br>B)
Q11: The Chandrasekhar limit is _ solar masses.<br>A)
Q12: A nova destroys the star and leaves
Q14: Massive stars cannot generate energy through iron
Q99: A nova is almost always associated with<br>A)
Q120: The energy a white dwarf emits into