Multiple Choice
Figure 9-1 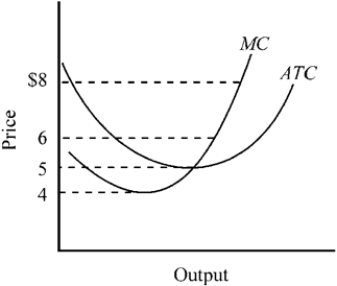
-Figure 9-1 shows the marginal and average total cost curves for a firm producing product A. What would be the minimum price this firm could charge and still continue to supply A to the market in the long run?
A) $4
B) $5
C) $6
D) $8
Correct Answer:

Verified
Correct Answer:
Verified
Q240: Figure 9-2 <img src="https://d2lvgg3v3hfg70.cloudfront.net/TB7348/.jpg" alt="Figure 9-2
Q241: Use the figure to answer the following
Q242: A union representing a group of workers
Q243: A competitive price-taker market in long-run equilibrium
Q244: Tom, a math major, examines Jane's economics
Q246: Suppose product price is $24; MR =
Q247: Regarding costs of production, can a firm
Q248: If a single firm in a price-taker
Q249: If marginal revenue exceeds marginal cost, a
Q250: Which of the following is true for