Multiple Choice
The graph below depicts the cost structure for a firm in a competitive market.
Figure 9-13 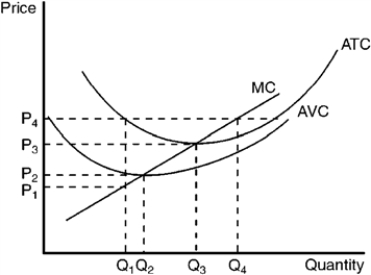
-Refer to Figure 9-13. When price rises from P2 to P3, the firm finds that
A) marginal cost exceeds marginal revenue at a production level of Q2.
B) if it produces at output level Q3 it will earn a positive profit.
C) expanding output to Q4 would leave the firm with losses.
D) it could increase profits by lowering output from Q3 to Q2.
Correct Answer:

Verified
Correct Answer:
Verified
Q223: When a competitive price-taker market is in
Q224: Which of the following is most likely
Q225: The owners of a firm are earning
Q226: When competition is present, self-interested business decision
Q227: Suppose sharply higher coffee prices lead to
Q229: Suppose the equilibrium price in a competitive
Q230: Union membership has fluctuated during the last
Q231: Use the table of expected cost and
Q232: Union membership as a percent of the
Q233: When the price of a product rises,