Multiple Choice
The graph below depicts the cost structure for a firm in a competitive market.
Figure 9-13 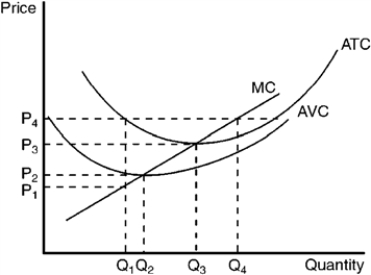
-Refer to Figure 9-13. When price falls from P3 to P1, the firm finds that
A) fixed cost is higher at a production level of Q1 than it is at Q3.
B) it should produce Q1 units of output.
C) it should produce Q3 units of output.
D) it should shut down immediately.
Correct Answer:

Verified
Correct Answer:
Verified
Q109: When profits occur in a competitive market,
Q110: If a product is manufactured under conditions
Q111: When a union successfully raises the wages
Q112: When firms in a price-taker market are
Q113: Suppose the demand for large (and therefore
Q115: Use the figure to answer the following
Q116: When new firms have an incentive to
Q117: If the demand for pizza falls, pizza
Q118: Several producers in industry A developed an
Q119: Amy runs a business in a market