Multiple Choice
The graph below depicts the cost structure for a firm in a competitive market.
Figure 9-13 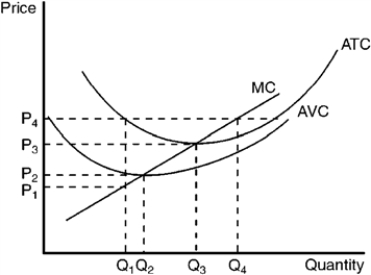
-Refer to Figure 9-13. When price rises from P3 to P4, the firm finds that
A) fixed costs are lower at a production level of Q4.
B) it can earn a positive profit by increasing production to Q4.
C) profit is still maximized at a production level of Q3.
D) average revenue exceeds marginal revenue at a production level of Q4.
Correct Answer:

Verified
Correct Answer:
Verified
Q166: Which of the following is most likely
Q167: When a firm is operating in a
Q168: If a decrease in the demand for
Q169: The main difference between a firm that
Q170: In a price-taker market, profits are<br>A) the
Q172: If resource prices rise and the average
Q173: Use the figure to answer the following
Q174: Since 1970, union membership, as a percent
Q175: Firms that are price takers<br>A) are small
Q176: If a product is manufactured under conditions