Multiple Choice
Figure 7-7 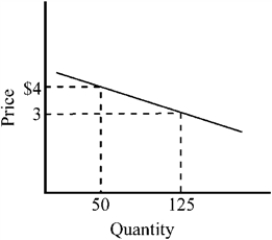
-In the price range between $3 and $4, the price elasticity of the demand curve depicted in Figure 7-7 is
A) highly elastic.
B) approximately equal to −0.33.
C) approximately equal to −3.
D) of unitary elasticity.
Correct Answer:

Verified
Correct Answer:
Verified
Related Questions
Q39: Growth in the share of health-care expenditures
Q40: During the last four decades, the share
Q41: Use the figure below to answer the
Q42: If rice is an inferior good,<br>A) the
Q43: Why is the current U.S. tax-treatment of
Q45: Which of the following is the best
Q46: Which of the following describes a situation
Q47: If the quantity demanded of a product
Q48: Healthcare price controls will lead to<br>A) more
Q49: When the Patient Protection and Affordable Care