Multiple Choice
Figure 7-17 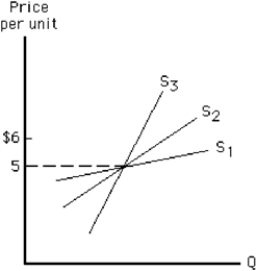
-Consider Figure 7-17. Between the prices of $5 and $6, which supply curve is most elastic and which is least elastic?
A) S1 is most elastic; S2 is least elastic.
B) S1 is most elastic; S3 is least elastic.
C) S3 is most elastic; S1 is least elastic.
D) S3 is most elastic; S2 is least elastic.
E) S2 is most elastic; S3 is least elastic.
Correct Answer:

Verified
Correct Answer:
Verified
Q20: If a third party pays a larger
Q21: Which of the following is true about
Q22: The phase out of the subsidies for
Q23: For a particular good, a 3 percent
Q24: If the elasticity of demand for cigarettes
Q26: When a good is more narrowly defined
Q27: Which of the following would help control
Q28: You and your college roommate eat three
Q29: After downing three glasses of lemonade on
Q30: If the price of tickets to Disney