Multiple Choice
Use the figure below to answer the following question(s) .
Figure 4-7 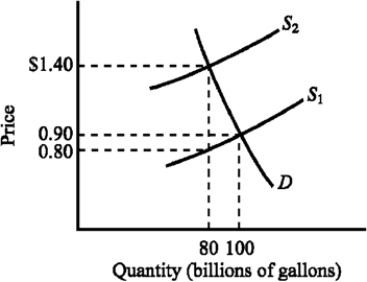
-Refer to Figure 4-7. The supply curve S1 and the demand curve D indicate initial conditions in the market for gasoline. A $.60-per-gallon excise tax on gasoline is levied, which shifts the supply curve from S1 to S2. Imposing the tax causes the equilibrium price of gasoline to increase from
A) $.80 to $1.40.
B) $.80 to $1.50.
C) $.90 to $1.50.
D) $.90 to $1.40.
Correct Answer:

Verified
Correct Answer:
Verified
Q82: A progressive tax<br>A) is one that taxes
Q83: Suppose the market equilibrium price of wheat
Q84: Which of the following generalizations about the
Q85: Use the figure below to answer the
Q86: Use the figure below to answer the
Q88: If the government wants to raise tax
Q89: Use the figure below to answer the
Q90: Data from the effects of the substantial
Q91: According to the Laffer curve,<br>A) an increase
Q92: A payment the government makes to either