Multiple Choice
Use the figure below to answer the following question(s) .
Figure 4-7 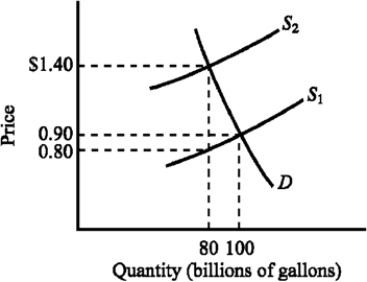
-Refer to Figure 4-7. The supply curve S1 and the demand curve D indicate initial conditions in the market for gasoline. A $.60-per-gallon excise tax on gasoline is levied. How much revenue does the $.60-per-gallon tax generate for the government?
A) $40 billion
B) $48 billion
C) $50 billion
D) $60 billion
Correct Answer:

Verified
Correct Answer:
Verified
Q254: Taxes create deadweight losses because they<br>A) reduce
Q255: Figure 4-14 <img src="https://d2lvgg3v3hfg70.cloudfront.net/TB7348/.jpg" alt="Figure 4-14
Q256: If a household has $40,000 in taxable
Q257: Other things constant, as the price of
Q258: The more elastic the supply of a
Q260: Figure 4-22 <img src="https://d2lvgg3v3hfg70.cloudfront.net/TB7348/.jpg" alt="Figure 4-22
Q261: Suppose the equilibrium price of a physical
Q262: Suppose the federal excise tax rate on
Q263: The average tax rate is defined as<br>A)
Q264: Which of the following statements is true?<br>A)