Multiple Choice
Use the figure below to answer the following question(s) .
Figure 4-12 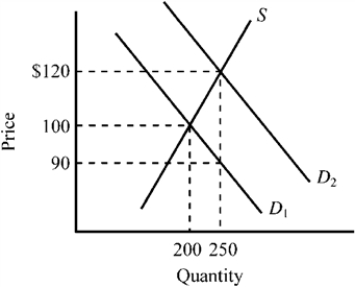
-Refer to Figure 4-12. The supply curve S and the demand curve D1 indicate initial conditions in the market for college textbooks. A new government program is implemented that grants students a $30 per textbook subsidy on every textbook they purchase, shifting the demand curve from D1 to D2. Which of the following is true for this subsidy given the information provided in the exhibit?
A) Textbook buyers will receive an actual benefit of $10 from the subsidy, while textbook sellers will receive an actual benefit of $20 from the subsidy.
B) Textbook buyers will receive an actual benefit of $20 from the subsidy, while textbook sellers will receive an actual benefit of $10 from the subsidy.
C) Textbook buyers will receive the full $30 benefit from the subsidy.
D) Textbook sellers will receive the full $30 benefit from the subsidy.
Correct Answer:

Verified
Correct Answer:
Verified
Q124: Which of the following examples illustrates a
Q125: A tax imposed on the sellers of
Q126: Figure 4-24 <img src="https://d2lvgg3v3hfg70.cloudfront.net/TB7348/.jpg" alt="Figure 4-24
Q127: Use the figure below illustrating the impact
Q128: If the supply of health care services
Q130: Figure 4-16 <img src="https://d2lvgg3v3hfg70.cloudfront.net/TB7348/.jpg" alt="Figure 4-16
Q131: About 35,000 general aviation multiengine airplanes are
Q132: Figure 4-24 <img src="https://d2lvgg3v3hfg70.cloudfront.net/TB7348/.jpg" alt="Figure 4-24
Q133: After a natural disaster, such as a
Q134: The actual benefit of a government subsidy