Multiple Choice
Use the figure below to answer the following question(s) .
Figure 4-13 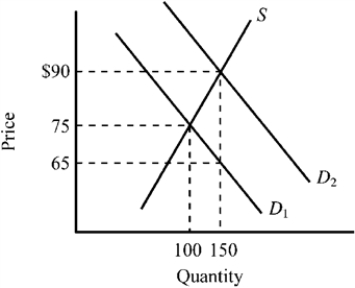
-Refer to Figure 4-13. The supply curve S and the demand curve D1 indicate initial conditions in the market for flu shots. A new government program is implemented that grants buyers a $25 subsidy when they buy a flu shot, shifting the demand curve from D1 to D2. Which of the following is true for this subsidy given the information provided in the figure?
A) The original price of a flu shot was $75, and after the subsidy, it rises to $90.
B) $65 represents the net price a buyer must pay for a flu shot after taking into account the subsidy payment.
C) Buyers of flu shots will receive an actual benefit of $10 from the subsidy, while sellers of flu shots will receive an actual benefit of $15 from the subsidy.
D) All of the above are true.
Correct Answer:

Verified
Correct Answer:
Verified
Q115: When policymakers impose price controls, they<br>A) are
Q116: Because of price controls in the former
Q117: A price floor that sets the price
Q118: A price floor set above an equilibrium
Q119: Economists have argued that rent control is
Q121: According to the Keynesian view, capitalism<br>A) is
Q122: Figure 4-20 <img src="https://d2lvgg3v3hfg70.cloudfront.net/TB7348/.jpg" alt="Figure 4-20
Q123: The marginal tax rate is defined as<br>A)
Q124: Which of the following examples illustrates a
Q125: A tax imposed on the sellers of