Multiple Choice
Figure 3-22 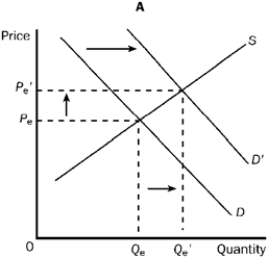
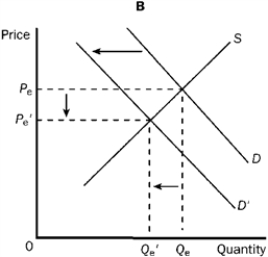
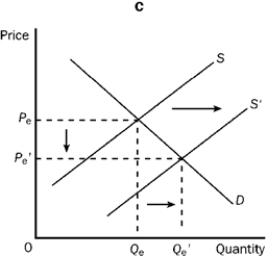
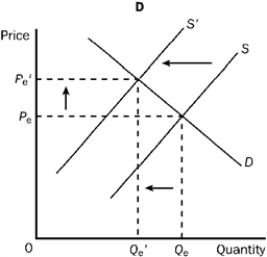
-Refer to Figure 3-22. Which of the four graphs represents the market for peanut butter after a major hurricane hits the peanut-growing south?
A) A
B) B
C) C
D) D
Correct Answer:

Verified
Correct Answer:
Verified
Related Questions
Q17: Which of the following will reduce the
Q18: When economists say the quantity demanded of
Q19: Which of the following has enhanced the
Q20: "A reduction in gasoline prices caused the
Q21: A decrease in the price of milk
Q23: Which of the following about stock is
Q24: If price falls, what happens to the
Q25: The random walk theory implies that stock
Q26: A cold spell in Florida extensively reduced
Q27: Other things constant, which of the following