Multiple Choice
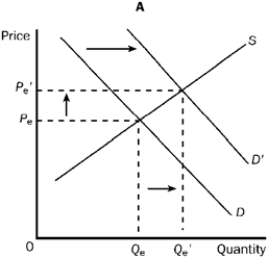
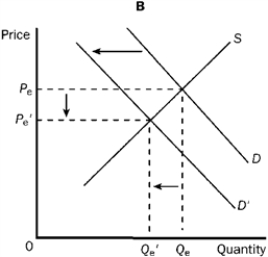
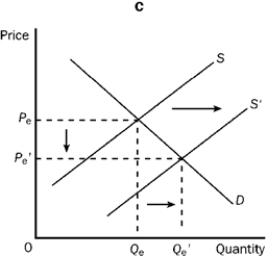
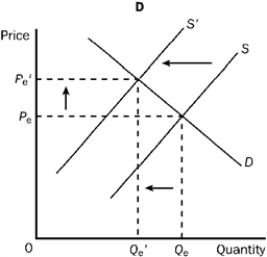
Figure 3-22 


-Refer to Figure 3-22. Which of the four graphs represents the market for cars as a result of the adoption of new technology on assembly lines?
A) A
B) B
C) C
D) D
Correct Answer:

Verified
Correct Answer:
Verified
Related Questions
Q281: Which of the following will tend to
Q282: Which of the following is true about
Q283: If the demand for a good is
Q284: The total economic cost of producing a
Q285: The maximum price that consumers are willing
Q287: To be economically successful, the entrepreneur must<br>A)
Q288: Which of the following would increase the
Q289: Which of the following investments is characterized
Q290: Regarding stocks and bonds, which of the
Q291: Which of the following would most likely