Multiple Choice
Figure 3-22 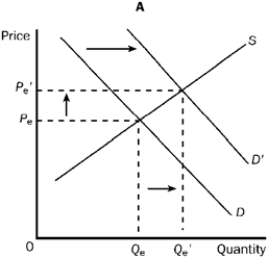
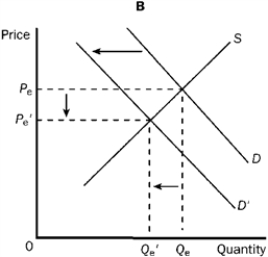
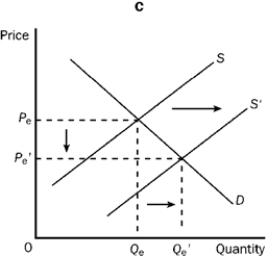
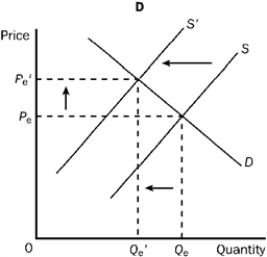
-Refer to Figure 3-22. Graph C shows which of the following?
A) An increase in demand and an increase in quantity supplied.
B) An increase in demand and an increase in supply.
C) An increase in quantity demanded and an increase in quantity supplied.
D) An increase in supply and an increase in quantity demanded.
Correct Answer:

Verified
Correct Answer:
Verified
Q302: Assume that corn and soybeans are alternatives
Q303: "He [the producer] intends only his gain,
Q304: <img src="https://d2lvgg3v3hfg70.cloudfront.net/TB7348/.jpg" alt=" Figure 3-17. -Refer
Q305: Figure 3-19 <img src="https://d2lvgg3v3hfg70.cloudfront.net/TB7348/.jpg" alt="Figure 3-19
Q306: Which of the following is true of
Q308: If price rises, what happens to the
Q309: In which statement(s) are "demand" and "quantity
Q310: A decrease in the expected future price
Q311: A decrease in demand will cause<br>A) an
Q312: Each point on the demand curve indicates<br>A)