Multiple Choice
Figure 3-22 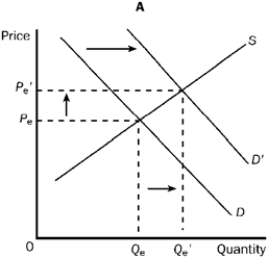
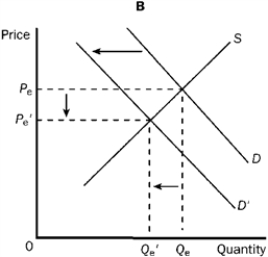
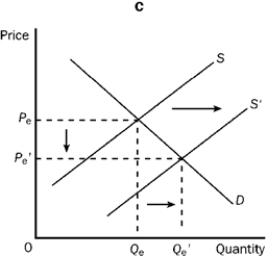
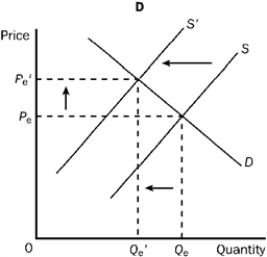
-Refer to Figure 3-22. Which of the four graphs illustrates an increase in quantity supplied?
A) A
B) B
C) C
D) D
Correct Answer:

Verified
Correct Answer:
Verified
Related Questions
Q48: Corn and soybeans are alternatives that could
Q49: Which of the following events would increase
Q50: Figure 3-18 <img src="https://d2lvgg3v3hfg70.cloudfront.net/TB7348/.jpg" alt="Figure 3-18
Q51: Which of the following is true of
Q52: Which of the following does the law
Q54: Which of the following is the best
Q55: Producers are willing to offer greater quantities
Q56: Jamal buys a new jacket for $50.
Q57: Kayla decides that she would pay as
Q58: How will a reduction in the price