Multiple Choice
Figure 3-22 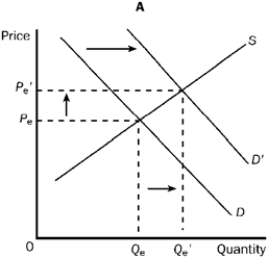
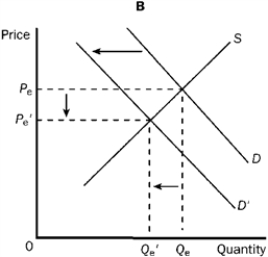
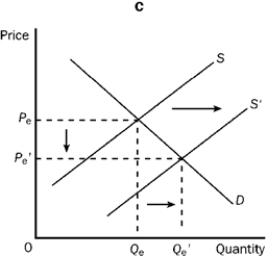
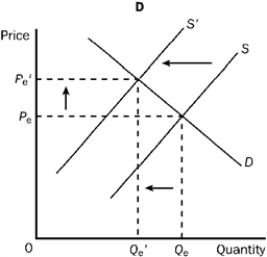
-Refer to Figure 3-22. Which of the four graphs illustrates a decrease in quantity demanded?
A) A
B) B
C) C
D) D
Correct Answer:

Verified
Correct Answer:
Verified
Related Questions
Q256: Which of the following would lead to
Q257: The market for new issues of stock
Q258: Figure 3-7 <img src="https://d2lvgg3v3hfg70.cloudfront.net/TB7348/.jpg" alt="Figure 3-7
Q259: Suppose a new law requires all piercing
Q260: Suppose both the equilibrium price and quantity
Q262: Other things being equal, the effect of
Q263: When economists say the quantity demanded of
Q264: The law of demand refers to the<br>A)
Q265: If the demand for coffee makers increases,<br>A)
Q266: Assume that eggnog and cookies are complements.