Multiple Choice
Figure 3-23 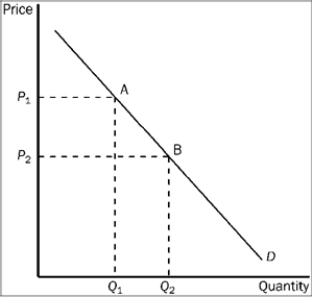
-Refer to Figure 3-23. The movement from point A to point B on the graph would be caused by
A) an increase in price.
B) a decrease in price.
C) a decrease in the price of a substitute good.
D) an increase in income.
Correct Answer:

Verified
Correct Answer:
Verified
Related Questions
Q90: Which of the following occurs when a
Q91: For a typical product, a decrease in
Q92: Suppose the demand for tacos decreases. What
Q93: If the interest rate were 10 percent,
Q94: Suppose the demand for nachos increases. What
Q96: An increase in the price of a
Q97: Which of the following is true of
Q98: If Georgia experiences a late frost that
Q99: The height of the supply curve at
Q100: Which of the following about demand is