Multiple Choice
Figure 11-17 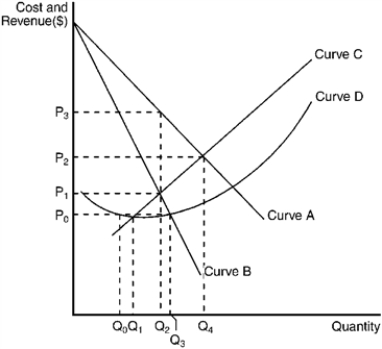
-Refer to Figure 11-17. The demand curve for a monopoly firm is depicted by curve
A) A.
B) B.
C) C.
D) D.
Correct Answer:

Verified
Correct Answer:
Verified
Related Questions
Q203: One of the effects of patents is
Q204: Government regulation is<br>A) subject to the same
Q205: Use the figure to answer the following
Q206: Collusion among sellers will be less attractive
Q207: Use the figure to answer the following
Q209: A profit-maximizing monopolist that produces in the
Q210: When entry barriers into a market are
Q211: Higher levels of carbon dioxide may have
Q212: Use the figure to answer the following
Q213: If the firms in an oligopolistic industry