Multiple Choice
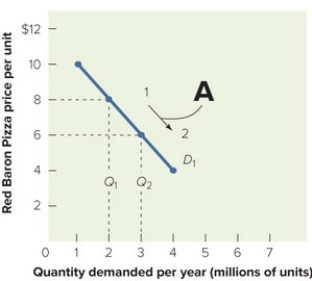 Figure 13-4A
-Figure 13-4A above shows that when the price for Red Baron frozen cheese pizzas moves from $8 to $6 per unit along the demand curve D1, the profit
A) increases from 6 to 8 million units per year.
B) decreases from 8 to 6 million units per year.
C) stays the same.
D) increases from $2 to $3 per unit.
E) cannot be determined; demand curves do not show a relationship to profit.
Correct Answer:

Verified
Correct Answer:
Verified
Q218: A demand curve is a graph that
Q219: In which type of industry would a
Q220: Companies often pursue a market share objective
Q221: Price elasticity of demand is expressed as<br>A)
Q222: Rent, executive salaries, and insurance are typical
Q224: What is the difference between a movement
Q225: The total expense incurred by a firm
Q226: Dozens of regional, private brands of peanut
Q227: The quantity at which total revenue and
Q228: Factors other than price affect demand. What