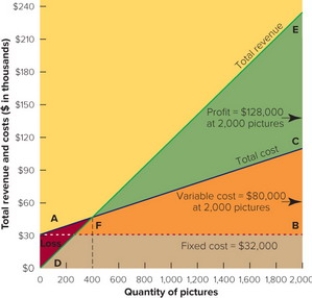
menu-iconExamlexExamLexServices

Discover

Ask a Question
  1. All Topics
  2. Topic
    Business
  3. Study Set
    Marketing Study Set 15
  4. Exam
    Exam 13: Building the Price Foundation
  5. Question
    Figure 13-7A -Figure 13-7 Above Depicts a
Solved

Figure 13-7A -Figure 13-7 Above Depicts a

Question 73

Question 73

Multiple Choice

  Figure 13-7A -Figure 13-7 above depicts a A)  Gantt chart. B)  demand curve. C)  break-even chart. D)  ROI analysis. E)  cross-tabulation. Figure 13-7A
-Figure 13-7 above depicts a


A) Gantt chart.
B) demand curve.
C) break-even chart.
D) ROI analysis.
E) cross-tabulation.

Correct Answer:

verifed

Verified

Unlock this answer now
Get Access to more Verified Answers free of charge

Related Questions

Q68: All of these are legal or ethical

Q69: All of these are alternate names for

Q70: The sum of the firm's expenses that

Q71: Break-even analysis is<br>A) a process that investigates

Q72: Three different objectives relate to a firm's

Q74: RadioShack, an electronics retail chain, couldn't compete

Q75: <img src="https://d2lvgg3v3hfg70.cloudfront.net/TB7462/.jpg" alt=" Figure 13-7B -In

Q76: Market share is the ratio of the

Q77: The break-even point (BEP) = [Fixed cost

Q78: The competitive market situation in which many

Examlex

ExamLex

About UsContact UsPerks CenterHomeschoolingTest Prep

Work With Us

Campus RepresentativeInfluencers

Links

FaqPricingChrome Extension

Download The App

Get App StoreGet Google Play

Policies

Privacy PolicyTerms of ServiceHonor CodeCommunity Guidelines

Scan To Download

qr-code

Copyright © (2025) ExamLex LLC.

Privacy PolicyTerms Of ServiceHonor CodeCommunity Guidelines