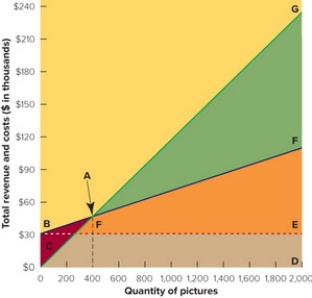
menu-iconExamlexExamLexServices

Discover

Ask a Question
  1. All Topics
  2. Topic
    Business
  3. Study Set
    Marketing Study Set 15
  4. Exam
    Exam 13: Building the Price Foundation
  5. Question
    Figure 13-7B -In the Break-Even Chart in Figure 13-7 Above, the Wedge
Solved

Figure 13-7B -In the Break-Even Chart in Figure 13-7 Above, the Wedge

Question 7

Question 7

Multiple Choice

  Figure 13-7B -In the break-even chart in Figure 13-7 above, the wedge ABC represents the firm's A)  fixed costs. B)  break-even point. C)  loss. D)  profit. E)  total revenue. Figure 13-7B
-In the break-even chart in Figure 13-7 above, the wedge ABC represents the firm's


A) fixed costs.
B) break-even point.
C) loss.
D) profit.
E) total revenue.

Correct Answer:

verifed

Verified

Unlock this answer now
Get Access to more Verified Answers free of charge

Related Questions

Q2: Price elasticity of demand is determined by

Q3: A graphic presentation of the break-even analysis

Q4: Which of these would be an example

Q5: <img src="https://d2lvgg3v3hfg70.cloudfront.net/TB7462/.jpg" alt=" Figure 13-7B -In

Q6: Specifying the role of price in an

Q8: Demand factors are<br>A) the various competitors that

Q9: Several pricing objectives relate to a firm's

Q10: If competitive market circumstances are such that

Q11: Which of these statements about the product

Q12: Inelastic demand exists when<br>A) a small percentage

Examlex

ExamLex

About UsContact UsPerks CenterHomeschoolingTest Prep

Work With Us

Campus RepresentativeInfluencers

Links

FaqPricingChrome Extension

Download The App

Get App StoreGet Google Play

Policies

Privacy PolicyTerms of ServiceHonor CodeCommunity Guidelines

Scan To Download

qr-code

Copyright © (2025) ExamLex LLC.

Privacy PolicyTerms Of ServiceHonor CodeCommunity Guidelines