Multiple Choice
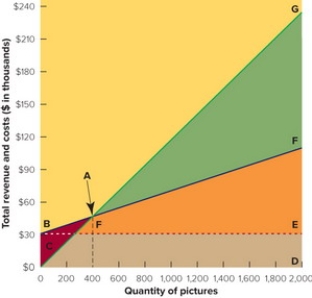 Figure 13-7B
-In the break-even chart in Figure 13-7 above, the triangular area FBE represents the firm's
A) fixed costs.
B) break-even point.
C) variable costs.
D) profit.
E) total revenue.
Correct Answer:

Verified
Correct Answer:
Verified
Related Questions
Q32: All of these are examples of pricing
Q33: Pure monopoly is the competitive market situation
Q34: SHAPE magazine is targeted at young women
Q35: When Pizza Hut announced it was going
Q36: Elastic demand exists when<br>A) a small percentage
Q38: Value pricing is<br>A) the ratio of perceived
Q39: Mrs. Renfro's, Inc., sells 25 different relishes
Q40: Which of these is true about a
Q41: While pricing objectives frequently reflect corporate goals,
Q42: Describe the types of competitive markets and