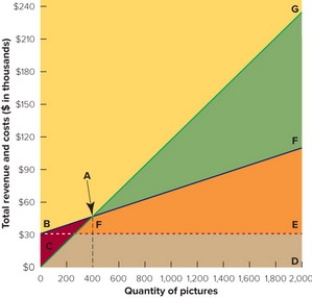
menu-iconExamlexExamLexServices

Discover

Ask a Question
  1. All Topics
  2. Topic
    Business
  3. Study Set
    Marketing Study Set 15
  4. Exam
    Exam 13: Building the Price Foundation
  5. Question
    Figure 13-7B -In the Break-Even Chart in Figure 13-7 Above, the Triangular
Solved

Figure 13-7B -In the Break-Even Chart in Figure 13-7 Above, the Triangular

Question 87

Question 87

Multiple Choice

  Figure 13-7B -In the break-even chart in Figure 13-7 above, the triangular area GAF represents the firm's A)  fixed costs. B)  break-even point. C)  variable costs. D)  profit. E)  total revenue. Figure 13-7B
-In the break-even chart in Figure 13-7 above, the triangular area GAF represents the firm's


A) fixed costs.
B) break-even point.
C) variable costs.
D) profit.
E) total revenue.

Correct Answer:

verifed

Verified

Unlock this answer now
Get Access to more Verified Answers free of charge

Related Questions

Q82: Which of these statements regarding price changes

Q83: Which of these statements about consumer demand

Q84: <img src="https://d2lvgg3v3hfg70.cloudfront.net/TB7462/.jpg" alt=" Figure 13-3 -In

Q85: Marketers may engage in value pricing, which

Q86: A maximizing current profit pricing objective implies

Q88: The competitive market situation in which many

Q89: <img src="https://d2lvgg3v3hfg70.cloudfront.net/TB7462/.jpg" alt=" Figure 13-3 -In

Q90: When estimating demand, price is not the

Q91: A break-even chart is a graphic presentation<br>A)

Q92: Many cosmetology schools allow their advanced students

Examlex

ExamLex

About UsContact UsPerks CenterHomeschoolingTest Prep

Work With Us

Campus RepresentativeInfluencers

Links

FaqPricingChrome Extension

Download The App

Get App StoreGet Google Play

Policies

Privacy PolicyTerms of ServiceHonor CodeCommunity Guidelines

Scan To Download

qr-code

Copyright © (2025) ExamLex LLC.

Privacy PolicyTerms Of ServiceHonor CodeCommunity Guidelines