Multiple Choice
The figure below is from an experiment on athletes. The "live high, train low" group lived for 18 days in rooms with a simulated altitude of 3,000 m, while training (exercising) at 1,200 m. Use this information and this figure to answer the following questions. 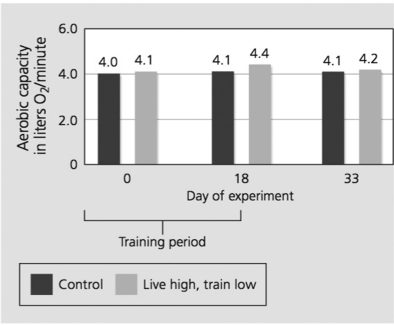
-What does the graph show about the experiment?
A) The increase in red blood cell production from living at a high altitude diminishes after returning to low altitude.
B) Living at high altitude does not have an effect on red blood cell production.
C) The increase in red blood cell production from living at a high altitude occurs from day 0.
Correct Answer:

Verified
Correct Answer:
Verified
Q15: An unknown liquid toxin in the environment
Q16: What structure do insects use for gas
Q17: <b>Scenario</b><br>Yawning is a reflexive action that is
Q18: Examine the figure shown. During breathing in
Q19: How does a shark's cardiovascular system differ
Q21: The figure below is from an experiment
Q22: Which group of people is most likely
Q23: In humans, oxygen is delivered from the
Q24: Which of these animals has a double
Q25: <b>Scenario</b><br>In sickle cell disease (SCD), a mutation