Multiple Choice
The figure below shows the growth curves of two populations of Paramecium, P. aurelia and P. caudatum. From the data, we can conclude that ________. 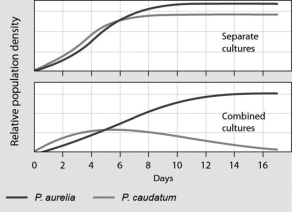
A) the ecological niches of the two species are very different
B) P) aurelia is a predator of P. caudatum
C) P) aurelia and P. caudatum have a mutualistic relationship
D) P) aurelia is the superior competitor in this habitat
Correct Answer:

Verified
Correct Answer:
Verified
Q6: Two lakes have the same number of
Q7: The major abiotic reservoir for phosphorus is
Q8: In the food chain grass → antelope
Q9: What is the range of actual efficiencies
Q10: Modern conservation science increasingly aims at _.<br>A)protecting
Q12: Besides the atmosphere, abiotic reservoirs of carbon
Q13: Species found in only one place on
Q14: With regard to nutrient pollution in aquatic
Q15: <img src="https://d2lvgg3v3hfg70.cloudfront.net/TB7803/.jpg" alt=" -In the ecosystem
Q16: A regional assemblage of interacting ecosystems is