Multiple Choice
The graph below shows data regarding radioactive decay of carbon-14. If decay continues to occur normally, how much C-14 will remain after 22,800 years? 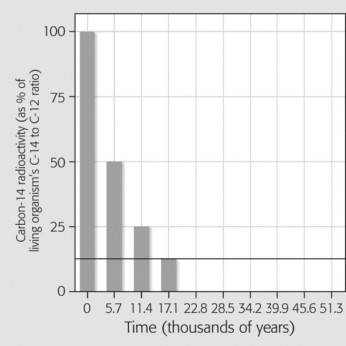
A) 25%
B) 12.5%
C) 6) 25%
D) 3) 125%
Correct Answer:

Verified
Correct Answer:
Verified
Related Questions
Q39: All of the following are potential negative
Q40: Examine the pH scale below. How does
Q41: Sugar dissolves when stirred into coffee. The
Q42: <b>Scenario</b><br>While radioactive isotopes are used in medicine
Q43: The data below are from three separate
Q45: Beryllium's atomic mass is 9, and its
Q46: The data below are from three separate
Q47: What are the four most common elements
Q48: Some tiny insects are able to walk
Q49: <b>Scenario</b><br>Please read the following scenario to answer