Multiple Choice
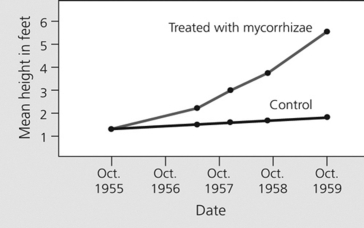 The figure shows results of a study where pine trees were treated with fungal mycorrhize to determine if the fungal mycorrhize would affect the growth of the pine trees. What time range showed the greatest change in mean height in feet?
A) Oct 1955 - Oct 1956
B) Oct 1956 - Oct 1957
C) Oct 1957 - Oct 1958
D) Oct 1958 - Oct 1959
Correct Answer:

Verified
Correct Answer:
Verified
Q1: Like plants, fungi have _; however, in
Q2: Why are gymnosperms considered to be "naked
Q4: In angiosperms, the _ is a nutrient-storing
Q5: If seed production had never evolved, which
Q6: Which component of a flowering plant is
Q7: What important role do fungi play in
Q8: The edible portion of a(n)_ is a
Q9: Producing millions of spores is an important
Q10: Which series of terms correctly illustrates the
Q11: Truffle mushrooms are an example of _.<br>A)a