Multiple Choice
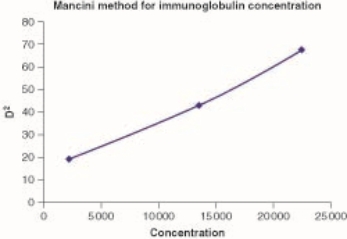
A) The graph in the figure shows the results of an endpoint incubation of an RID using the Mancini method to plot density squared (d2) versus concentration
B) The graph in the figure shows the results of an endpoint incubation of an RID using the Fahey method to plot d2 versus concentration
C) The graph in the figure shows the results of an endpoint incubation of an RID using the Mancini method to plot diameter squared versus concentration.
D) The graph shows none of the above.
Correct Answer:

Verified
Correct Answer:
Verified
Q13: Radial immunodiffusion can be used to measure<br>A)IgM,
Q14: Regarding the affinity of antibody to antigen,<br>A)Ka
Q15: When a mom and a dad have
Q16: <img src="https://d2lvgg3v3hfg70.cloudfront.net/TB5510/.jpg" alt=" In the Ouchterlony
Q17: In PETINA,<br>A)the residual nonagglutinating particles are counted<br>B)the
Q19: Equivalence occurs when the<br>A)antibody-binding sites approximately equal
Q20: Agglutination is<br>A)less sensitive than precipitation<br>B)more sensitive than
Q21: A plot of D<sup>2</sup> versus concentration is
Q22: In nephelometry,<br>A)antibody and antigen form complexes that
Q23: The serum of a patient with pneumonia