Multiple Choice
Table
Factors for Calculating Three- Sigma Limits for the - chart and - chart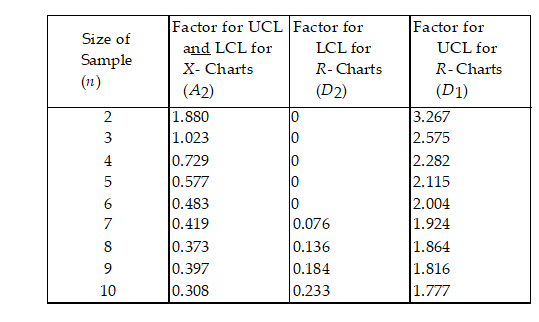
-A milling operation has historically produced an average thickness of 0.005 inch with an average range of 0.0015 inch. Currently, the first three items from each batch of 20 are inspected.
Use Table 1.. What is the value of LCL ) if the sample size is increased to 6?
A) less than or equal to 0.0030
B) greater than 0.0030 but less than or equal to 0.0049
C) greater than 0.0049 but less than or equal to 0.0069
D) greater than 0.0069
Correct Answer:

Verified
Correct Answer:
Verified
Q86: When is it advantageous to use sampling
Q141: The upper limit and lower specifications for
Q142: Describe and explain the steps necessary for
Q143: In applying quality control charts, assignable causes
Q144: The _ is a cycle used
Q145: A product is composed of three subsystems
Q147: A company is interested in monitoring
Q148: Reliability is the probability that the product
Q150: _ is an approach that involves combining
Q151: The UCL and LCL for an X-