Multiple Choice
Table 7.1
Factors foe Calculating Thee- Segma L.tmits for the -chart and -chart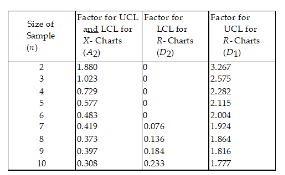
-Historically, the average diameter of the holes drilled has been 0.25 cm and the average range has been 0.1 cm. Determine the central line and upper and lower control limits for an and an R- chart, assuming samples of size 8 will be taken. Use Table 7.1. For the R- chart, what is the value of the UCLR ?
A) less than or equal to 0.1000
B) greater than 0.1000 but less than or equal to 0.1510
C) greater than 0.1510 but less than or equal to 0.2020
D) greater than 0.2020
Correct Answer:

Verified
Correct Answer:
Verified
Q59: Which one of the following statements concerning
Q60: The foundation to Deming's philosophy to quality
Q61: Describe the distinction between common and assignable
Q62: Customers assess quality solely on the basis
Q64: Four major costs categories are associated with
Q66: A measure of the dispersion of observations
Q67: Which one of the following statements is
Q89: A(n) _ specifies the sample size, the
Q90: _ means that customers expect the product
Q164: _ costs are associated with preventing defects