Multiple Choice
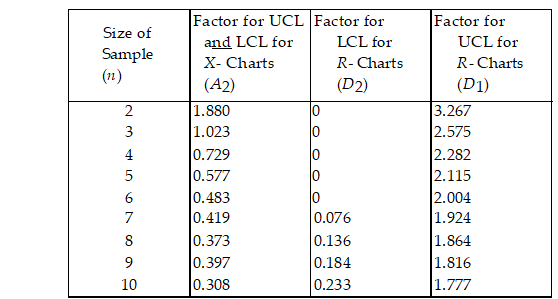
-Historically, the average diameter of the holes drilled has been 0.25 cm and the average range has been 0.1 cm. Determine the central line and upper and lower control limits for an and an R- chart, assuming samples of size 8 will be taken. Use Table 7.1. For the R- chart, what is the value of the LCLR?
A) less than or equal to 0.010
B) greater than 0.010 but less than or equal to 0.020
C) greater than 0.020 but less than or equal to 0.030
D) greater than 0.030
Correct Answer:

Verified
Correct Answer:
Verified
Q18: One of the principles that total quality
Q97: _ is a continuous, systematic procedure that
Q183: The implementation of a total quality management
Q184: The manufacturing of compact disks requires four
Q188: Which one of the following is NOT
Q189: "Conformance to specifications" implies that<br>A) quality performance
Q190: Which alternative will increase the probability of
Q191: _ philosophy was that quality is the
Q192: Which of the following can be used
Q212: A(n) _ is a diagram that relates