Essay
The operations manager has narrowed down the search for a new plant to three locations. Fixed and variable costs follow: Plot the total cost curves in the chart provided below, and identify the range over which each location would be best. Then use break- even analysis to calculate exactly the break- even quantity that defines each range. 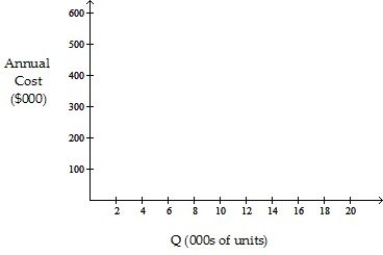 a. What is the break- even quantity between A and B?
b. What is the break- even quantity between B and C?
Correct Answer:

Verified
Correct Answer:
Verified
Q102: One dominant factor in locating manufacturing facilities
Q125: Immediate predecessors are the smallest units of
Q158: Table 10.16<br>Balance the following lines for
Q159: One of the advantages of building a
Q161: Identify and briefly explain four of the
Q162: Relative to product layouts, an advantage of
Q164: Euclidean distance is the distance between two
Q165: When outbound transportation costs are a dominant
Q166: The process layout organizes resources according to
Q168: The production of a product consists