Multiple Choice
Which of the following is the best interpretation of the graph below of mussel size (x-axis) versus energy gain (line graph, left y-axis) , and number of mussels eaten per day (histogram, right y-axis) ? 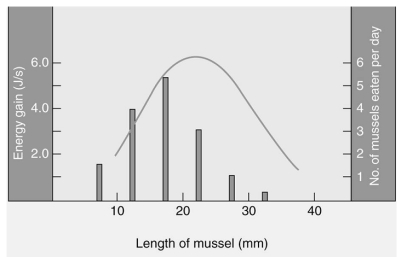
A) Mussels are selected as food sources by crabs.
B) Crabs select mussels in a way that maximizes their energy gain.
C) Mussel size does not seem to be a good predictor as to which mussel hungry crabs will select.
D) Crabs tend to consume most of the largest mussels.
Correct Answer:

Verified
Correct Answer:
Verified
Q63: In species where the young are precocial,meaning
Q69: Female fire beetles, Melanophilia sp., must seek
Q70: What is the term for learning that
Q71: Male hummingbirds flash a patch of iridescent
Q72: In an experiment studying predator and prey
Q74: Which of the following statements best defines
Q75: A behavior that has evolved to aid
Q77: Which of the following is an appropriate
Q78: In its youth, a pet parrot was
Q79: A friend of yours is wondering about