Multiple Choice
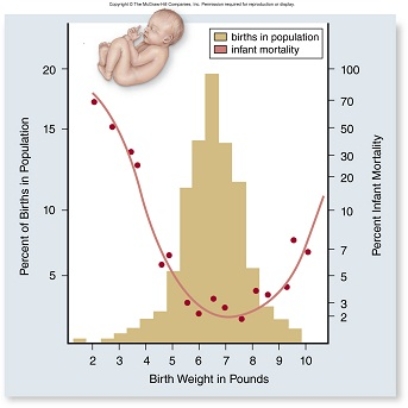 In the graph above, how can the change in infant mortality be explained as birth weight increases from 2 to 7 pounds?
A) A larger baby will have more developed organs and thus have greater fitness.
B) A baby closer to 7 pounds will have more developed organs and thus have lower mortality.
C) A baby closer to 2 pounds will not be able to be delivered safely and thus have lower mortality.
D) A baby closer to 7 pounds will have more developed organs and thus have higher motality.
Correct Answer:

Verified
Correct Answer:
Verified
Q35: In order for natural selection to occur
Q36: In a small population of cockroaches living
Q37: Antigens on red blood cells are hereditary
Q38: In the Hardy-Weinberg equation, p and q
Q39: Moths that can evade a bat's echolocation
Q41: Average human males are most likely to
Q42: In early ancestors of the modern giraffe,
Q43: The observation that most pureblood Native Americans
Q44: In disruptive selection, over time<br>A)a population increases
Q45: Natural selection for a certain phenotype will