Multiple Choice
Case-Based Critical Thinking Questions
Case 3-1
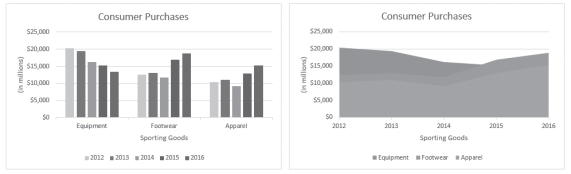
Column Chart Area Chart
Sarah has put together the same information in two different charts, shown in the figure above, to present to her boss. She is thinking through the pros and cons of each chart type.
-What is one of the weaknesses of the column chart shown above?
A) too many columns
B) too few columns
C) inaccurate data
D) choice of x- and y-axis
Correct Answer:

Verified
Correct Answer:
Verified
Q106: The chart title is the descriptive text
Q107: Excel offers two pie chart sub-types, Pie
Q108: One of the features of 100% stacked
Q109: Doughnut charts are a way to show
Q110: List and explain briefly the five guidelines
Q112: The _ chart type displays value trends
Q113: Radar charts are like area charts-but whereas
Q114: An X Y (_) chart plots numeric
Q115: The _ is the descriptive text that
Q116: MATCHING<br> <img src="https://d2lvgg3v3hfg70.cloudfront.net/TB3934/.jpg" alt="MATCHING