Multiple Choice
Case-Based Critical Thinking Questions
Case 3-1
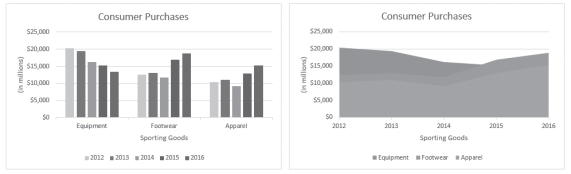
Column Chart Area Chart
Sarah has put together the same information in two different charts, shown in the figure above, to present to her boss. She is thinking through the pros and cons of each chart type.
-An area chart combines the features of a ____ by filling in the area below the line, and displaying the trend of values over time or categories.
A) line chart with a bar or column chart
B) bar chart with a column chart
C) scatter chart with a radar chart
D) bubble chart with a surface chart
Correct Answer:

Verified
Correct Answer:
Verified
Q62: The _ trendline is used to smooth
Q63: An Excel chart requires _ numeric data
Q64: Data series are points in a data
Q65: By Columns By Rows<br> <img src="https://d2lvgg3v3hfg70.cloudfront.net/TB3934/.jpg" alt="By
Q66: Case-Based Critical Thinking Questions<br>Case 3-1<br> <img src="https://d2lvgg3v3hfg70.cloudfront.net/TB3934/.jpg"
Q68: The Format Axis task pane allows you
Q69: In the Format Data Labels task pane,
Q70: The _ dialog box, which is available
Q71: Identify the letter of the choice that
Q72: MATCHING<br> <img src="https://d2lvgg3v3hfg70.cloudfront.net/TB3934/.jpg" alt="MATCHING