Multiple Choice
By Columns By Rows
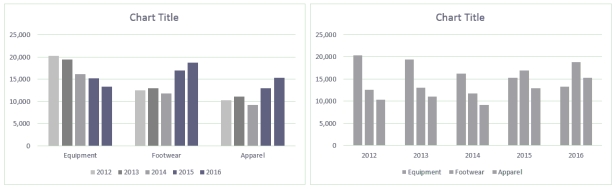
Ross always looks at data in more than one way. He discovered a feature in Excel that allows him to display the chart By Column and By Rows, as shown in the above figure.
-When the chart is plotted by columns, what information does it emphasize?
A) comparing the amount of each year's sales for each of the three categories
B) the contribution that each category made to each year's performance
C) the percentage of total sales that each of the three categories make up
D) none of the above
Correct Answer:

Verified
Correct Answer:
Verified
Q49: By Columns By Rows<br> <img src="https://d2lvgg3v3hfg70.cloudfront.net/TB3934/.jpg" alt="By
Q50: The _ is the vertical axis where
Q51: According to Tufte, _ can make charts
Q52: The _ is the horizontal axis where
Q53: Use a pie chart when it's most
Q55: The design of statistical graphics is the
Q56: Use the Trendline options on the Chart
Q57: In business, charts are typically used to
Q58: You must make changes to the content
Q59: MATCHING<br> <img src="https://d2lvgg3v3hfg70.cloudfront.net/TB3934/.jpg" alt="MATCHING