Multiple Choice
MATCHING
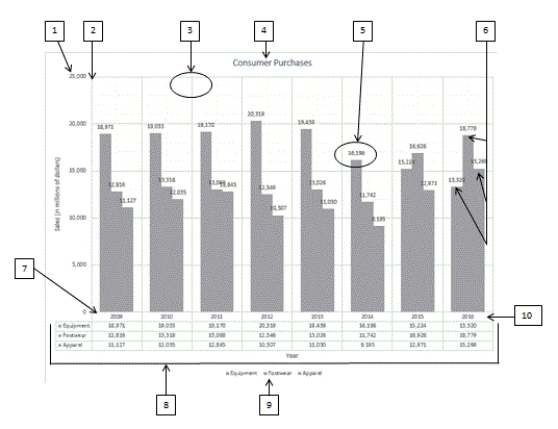
Using the above figure, identify the letter of the choice that best matches the figure.
-#7
A) Data series
B) Chart title
C) Data table
D) X-axis labels
E) X-axis
F) Legend
G) Y-axis
H) Y-axis labels
I) Gridlines
J) Data point with data label
Correct Answer:

Verified
Correct Answer:
Verified
Q113: Radar charts are like area charts-but whereas
Q114: An X Y (_) chart plots numeric
Q115: The _ is the descriptive text that
Q116: MATCHING<br> <img src="https://d2lvgg3v3hfg70.cloudfront.net/TB3934/.jpg" alt="MATCHING
Q117: Any changes to the data label content
Q119: Bubble charts allow three-dimensional data to be
Q120: In a _ chart, values are indicated
Q121: Charts can be either embedded as an
Q122: Microsoft Excel _ provide a visual representation
Q123: Excel provides 10 standard chart types, with