Multiple Choice
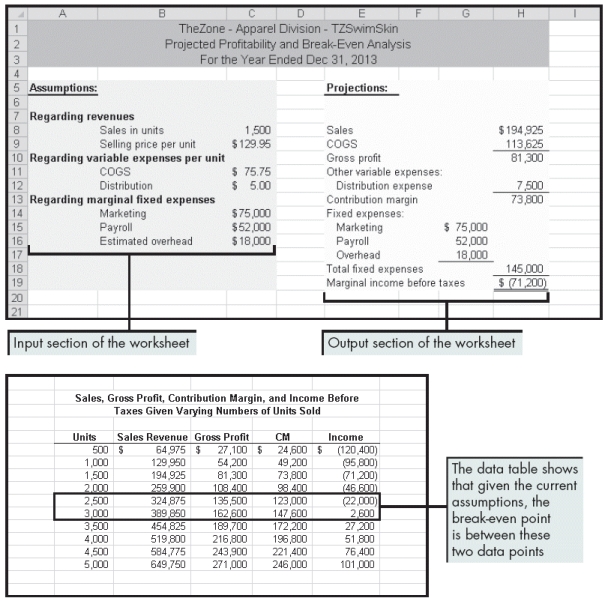
Beckham created the worksheets above to show the profitability and break-even points for his company. Please refer to the figure above as you answer the questions below.
-Beckham has received word from the Purchasing Department that there could be some variance in the COGS. He wants to develop a worksheet that shows the effects of various interactions between the selling price and the cost of goods sold per unit on profitability. In the two-variable data table, how would he set it up?
A) Place COGS and selling price next to each other in a column, and the table's output formula for income in the third column.
B) Place COGS and selling price perpendicular to each other, and the table's output formula for income in the intersection of these two sets of input variables.
C) Place income and selling price perpendicular to each other, and the table's output formula for COGS in the intersection of these two sets of input variables.
D) Place COGS and selling price in two subsequent rows, with the table's output formula for income in the third row.
Correct Answer:

Verified
Correct Answer:
Verified
Q137: In financial statistics, a probability distribution assigns
Q138: The contribution margin represents the amount of
Q139: A(n) one-variable data table has only one
Q140: Identify the letter of the choice that
Q141: A defined name can be used outside
Q143: To create a(n) scenario, you plan the
Q144: Although a PivotTable usually summarizes information into
Q145: A(n) _ data table has two lists
Q146: <img src="https://d2lvgg3v3hfg70.cloudfront.net/TB3934/.jpg" alt=" Gabriel created
Q147: To determine the _ in a worksheet,