Multiple Choice
The figure shows a graph of the resistance of a wire as a function of its length. What physical quantities does the slope of this graph represent? 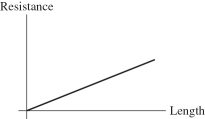
A) the cross-sectional area of the wire
B) the resistivity of the material of which the wire is made
C) the product of the resistivity and the cross-sectional area of the wire
D) the resistivity of the material divided by the cross-sectional area of the wire
E) the reciprocal of the resistivity of the material
Correct Answer:

Verified
Correct Answer:
Verified
Q25: A 120-Ω laboratory resistor is rated at
Q37: The voltage drop across a metal
Q41: How much current will be flowing
Q78: Consider two copper wires of equal cross-sectional
Q87: A tube of mercury with resistivity 9.84
Q117: A 4000-Ω resistor is connected across a
Q141: A certain metal wire has a cross-sectional
Q142: A 200-Ω resistor is rated at 1/4
Q149: The length of a certain wire is
Q170: How much energy does a 100-W light