Multiple Choice
The figure shows a graph of the power dissipated in a resistor as a function of the resistance. What quantity does the slope of this graph represent? 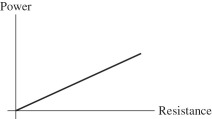
A) the current in the resistor
B) the potential difference across the resistor
C) the reciprocal of the current in the resistor
D) the square of the current in the resistor
E) the resistivity of the resistor
Correct Answer:

Verified
Correct Answer:
Verified
Q2: A certain metal has a resistivity of
Q24: A battery supplies 6.0 mA to a
Q71: The power rating of a 400-Ω resistor
Q74: A wire of resistivity ρ must be
Q100: For the graph shown in the figure,
Q103: The graph shown in the figure shows
Q115: If we double the resistance in a
Q192: The heating element of a toaster is
Q212: Which one of the following quantities is
Q225: You are given a copper bar of