Short Answer
The graph shown in the figure shows the results of measurements of the dc current through a circuit device for various potential differences across it. Assume that all the numbers shown are accurate to two significant figures. What is the resistance of this device? 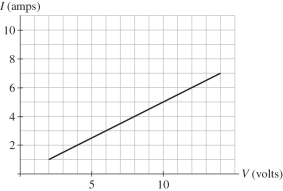
Correct Answer:

Verified
Correct Answer:
Verified
Related Questions
Q17: A 1.0-mm diameter extension cord is made
Q17: For the graph shown in the figure,
Q22: When 5.00 A is flowing through an
Q37: What is the resistance of 1.0 m
Q77: When current is flowing in an ordinary
Q125: A 10-A current flows through a wire
Q167: A light bulb operating at 110 V
Q169: If the length and diameter of a
Q176: Consider two copper wires of equal cross-sectional
Q197: A 1.0-m length of nichrome wire has