Short Answer
The graph in the figure represents the velocity of a particle as it travels along the x-axis. What is the average acceleration of the particle between t = 2.0 s and t = 4.0 s? 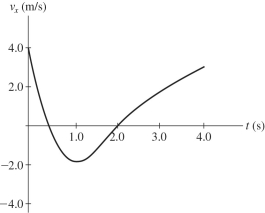
Correct Answer:

Verified
Correct Answer:
Verified
Related Questions
Q20: A ball is thrown straight up with
Q57: A car is traveling with a constant
Q73: Consider a car that travels between points
Q79: Abby throws a ball straight up and
Q95: A car accelerates from <span
Q105: A baseball is hit with a bat
Q108: When is the average velocity of an
Q135: A foul ball is hit straight up
Q240: A race car circles 10 times around
Q512: If the position versus time graph of