Short Answer
The graph in the figure shows the velocity of a particle as it travels along the x-axis. (a)In what direction (+x or -x)is the acceleration at t = 0.5 s?
(b)In what direction (+x or -x)is the acceleration at t = 3.0 s?
(c)What is the average acceleration of the particle between t = 2.0 s and t = 4.0 s?
(d)At what value of t is the instantaneous acceleration equal to 0 m/s2? 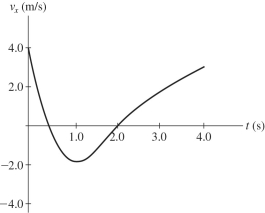
Correct Answer:

Verified
(a)-x (b)+...View Answer
Unlock this answer now
Get Access to more Verified Answers free of charge
Correct Answer:
Verified
View Answer
Unlock this answer now
Get Access to more Verified Answers free of charge
Q26: You are driving home on a weekend
Q37: An object is dropped from a bridge.A
Q39: A motorist travels 160 km at 80
Q78: The area under a curve in a
Q104: A car is traveling with a constant
Q117: A 10-kg rock and a 20-kg rock
Q136: Car A is traveling at twice the
Q143: A car is able to stop
Q145: A ball is projected upward at
Q148: If, in the figure, you start from