Short Answer
The figure shows a graph of the position of a moving object as a function of time. What is the velocity of the object at each of the following times?
(a)At t = 1.0 s
(b)At t = 2.5 s
(c)At t = 4.0 s
(d)At t = 5.5 s 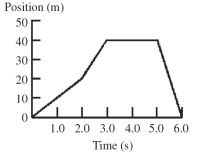
Correct Answer:

Verified
(a)10 m/s ...View Answer
Unlock this answer now
Get Access to more Verified Answers free of charge
Correct Answer:
Verified
(a)10 m/s ...
View Answer
Unlock this answer now
Get Access to more Verified Answers free of charge
Related Questions
Q1: A car increases its forward velocity uniformly
Q27: An auto manufacturer advertises that their car
Q40: You drive 6.0 km at 50 km/h
Q48: An object is moving with constant non-zero
Q53: Which of the following graphs represent an
Q74: Two athletes jump straight up.John has twice
Q92: A laser is thrown upward with a
Q102: A bullet shot straight up returns to
Q182: If the velocity of an object is
Q251: A bat, flying toward the east at