Short Answer
The figure shows a graph of the position of a moving object as a function of time.
(a)What is the average velocity of the object from t = 0 s to t = 4.0 s?
(b)What is the average velocity of the object from t = 0 s to t = 6.0 s? 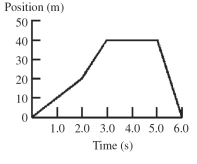
Correct Answer:

Verified
Correct Answer:
Verified
Related Questions
Q3: A rock is projected upward from the
Q26: The graph in the figure shows the
Q27: A train starts from rest and
Q32: A toy rocket is launched vertically
Q41: A car travels at 15 m/s for
Q62: A runner runs around a track consisting
Q87: A rock from a volcanic eruption is
Q97: When a ball is thrown straight up
Q124: A car is moving with a speed
Q127: Starting from rest,a dragster travels a straight