Short Answer
The figure shows a graph of the velocity of an object as a function of time. What is the average acceleration of the object over the following time intervals?
(a)From t = 0 s to t = 5.0 s
(b)From t = 0 s to t = 8.0 s 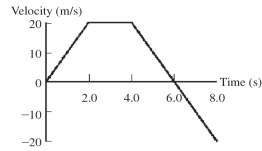
Correct Answer:

Verified
(a)2.0 m/s...View Answer
Unlock this answer now
Get Access to more Verified Answers free of charge
Correct Answer:
Verified
View Answer
Unlock this answer now
Get Access to more Verified Answers free of charge
Q21: To determine the height of a flagpole,Abby
Q33: The slope of a position versus time
Q42: Which of the following situations is impossible?<br>A)An
Q53: An astronaut stands by the rim of
Q58: The graph in the figure shows the
Q61: A ball is thrown straight upward
Q64: If, in the figure, you start from
Q91: A car starting from rest accelerates at
Q130: A runner runs around a track consisting
Q493: Human reaction times are worsened by alcohol.