Multiple Choice
The following graph shows the total utility obtained from rice crackers and beer by Carla.
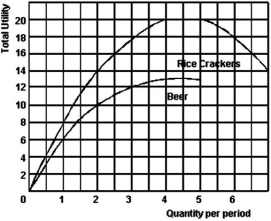
-Refer to the above graph to answer this question.If the price of rice crackers are $2,beer is $3,and Carla has a budget of $14,how much of each will she purchase if she wishes to maximize her total utility?
A) 1 cracker and 4 beers.
B) 2 crackers and 3 beers.
C) 3 crackers and 3 beers.
D) 4 crackers and 2 beers.
E) 5 crackers and 1 beer.
Correct Answer:

Verified
Correct Answer:
Verified
Q106: Refer to Table 5.13 to answer this
Q107: <img src="https://d2lvgg3v3hfg70.cloudfront.net/TB5692/.jpg" alt=" -Refer to Table
Q108: For the following diagram,suppose the quantity traded
Q109: The following table shows Ketta's utility for
Q110: "When a consumer chooses between two products,it
Q112: What is meant by the term utility?<br>A)A
Q113: You have determined that the following utility
Q114: The following table shows Erica's utility for
Q115: <img src="https://d2lvgg3v3hfg70.cloudfront.net/TB5692/.jpg" alt=" -Refer to the
Q116: The following table shows Mia's $ marginal