Multiple Choice
The graph below illustrates three demand curves.
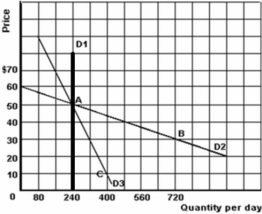
-Refer to the graph above to answer this question.Which of the following statements is correct?
A) Demand curve D3 is the most inelastic demand.
B) Equilibrium price must be $50.
C) If price is $30 and demand is D3 then the quantity demanded is 720 units per day.
D) Demand curve D1 is more inelastic than D3.
E) Demand curve D1 is perfectly elastic.
Correct Answer:

Verified
Correct Answer:
Verified
Q29: How can the cross-price elasticity be used
Q138: If the government puts a $3 excise
Q139: The list below refers to the price
Q140: The list below refers to the price
Q141: Suppose that the price of Product A
Q142: Which of the two following pairs of
Q144: <img src="https://d2lvgg3v3hfg70.cloudfront.net/TB5692/.jpg" alt=" -Graphically,what is the
Q146: What is a normal good?<br>A)It is a
Q147: Suppose that household income in Charlottetown increases
Q148: What is the effect on total revenue