Multiple Choice
Below is a graphical representation of the wheat market in the distant land of Nod.
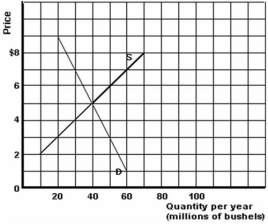
-Refer to the graph above to answer this question.If supply was increased by 30 million bushels,what would be the new equilibrium price and quantity?
A) $3 and 20 million bushels.
B) $3 and 50 million bushels.
C) $3 and 70 million bushels.
D) $7 and 30 million bushels.
E) $7 and 60 million bushels.
Correct Answer:

Verified
Correct Answer:
Verified
Q90: What is the main determinant of the
Q91: What is the elasticity of supply of
Q92: Below are some data on price,income and
Q93: Suppose that the value of the price
Q94: <img src="https://d2lvgg3v3hfg70.cloudfront.net/TB5692/.jpg" alt=" -Refer to the
Q96: What is the effect on total revenue
Q97: A straight-line (constant-sloped)demand curve does not imply
Q98: What do products such as movies,tomatoes and
Q99: Under which of the following situations will
Q100: <img src="https://d2lvgg3v3hfg70.cloudfront.net/TB5692/.jpg" alt=" -Refer to the